A quick guide to calculating labour turnover
28th Feb '24


We already have the ability to create departments and to add employees to a department (or multiple departments).
That gives you a single level of analysis for your data which is sufficient for most of you.
But many of you that are integrating platforms into us need additional levels of data analysis.
Sometimes this relates to a location, or a team, or a client, or a project.
So we’ve introduced “Tags”
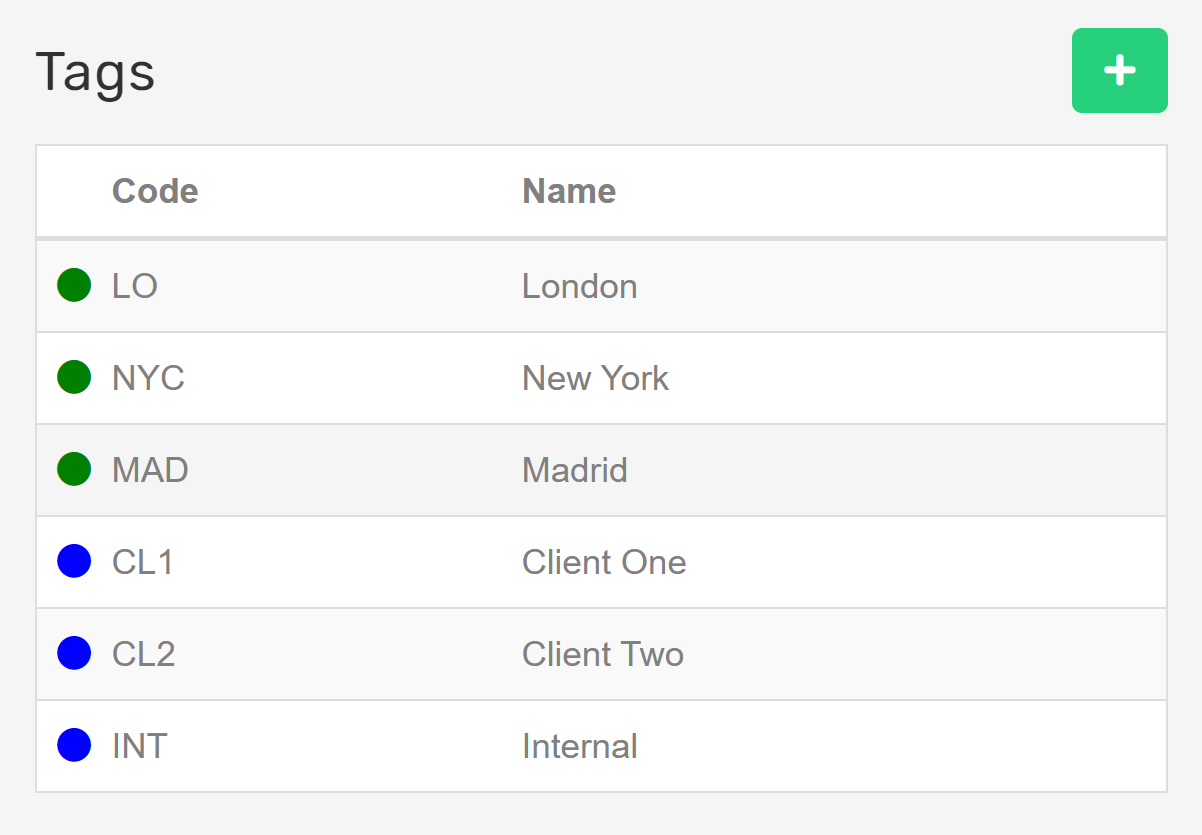
From the Settings menu, choose ‘Tags’.
You can add as many tags as you want, and you can set a color code for each tag for easy visual reference.
The only restriction is that the code for the Tag must be unique

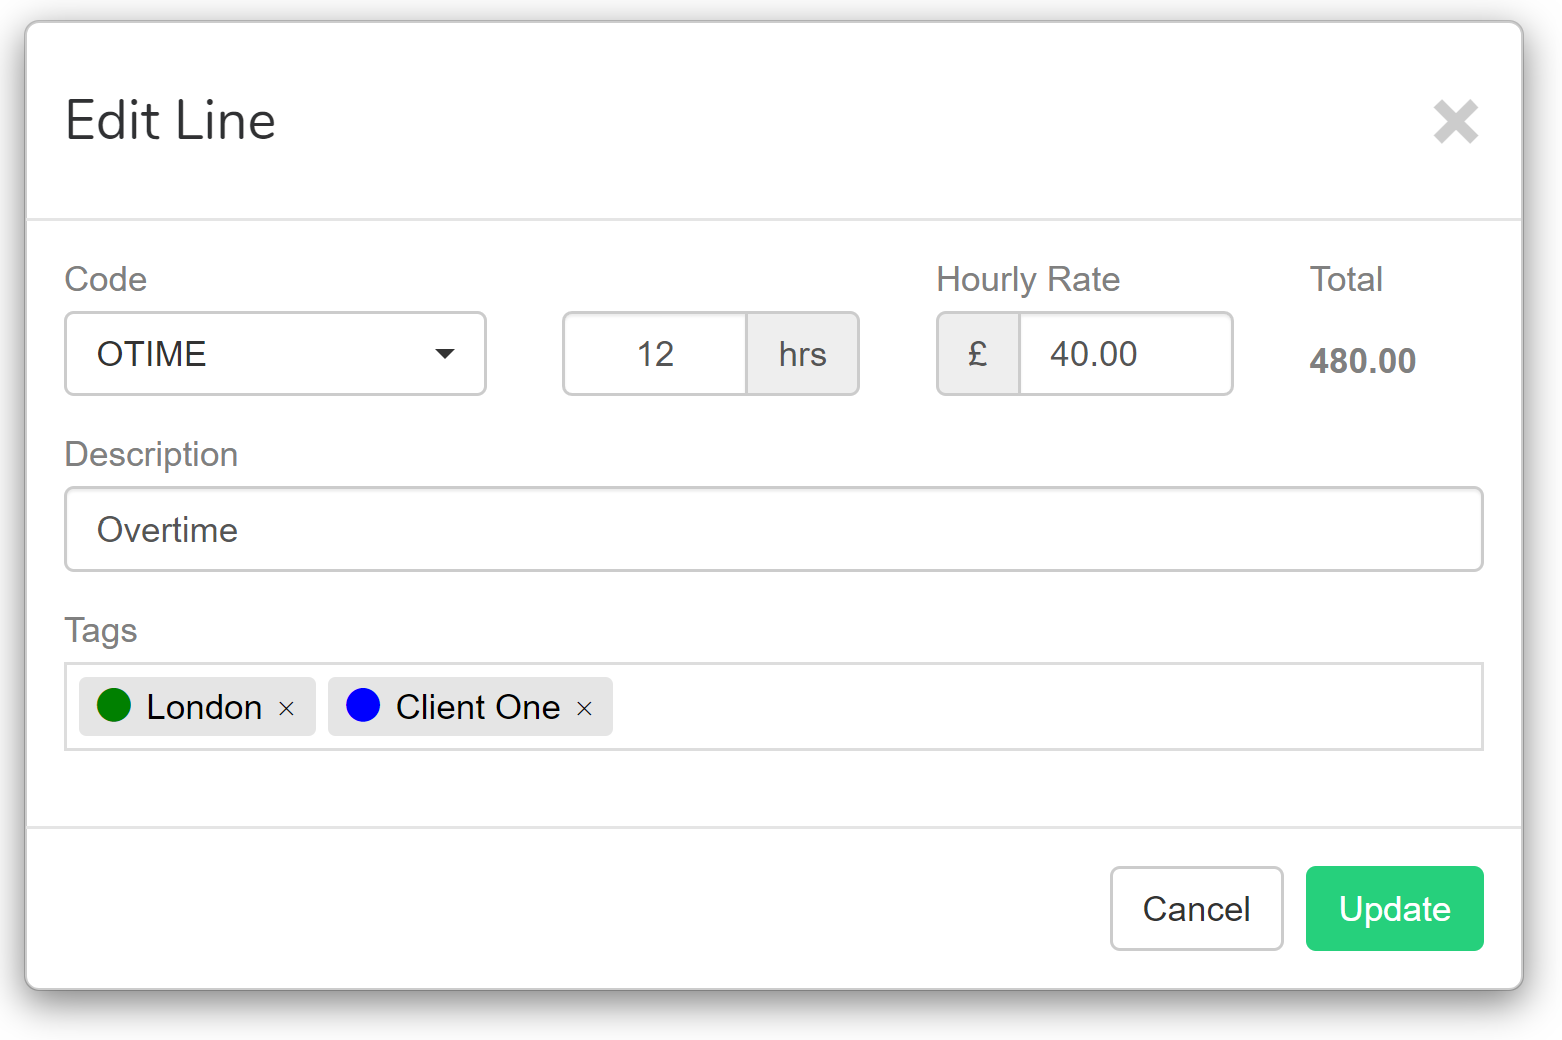
Tags are applied to amounts that the employee is paid.
As well as tagging the regular pay amount, you can also tag any additions or deductions.
Tags are treated the same as any other part of the Pay Options, so you can set defaults and so on.
We may later allow you to tag other things, such as employees themselves.

As with all of the features in our software, you can manage Tags via the API.
None of our standard reports yet allow you to filter based on these tags. But the fields are all exposed via the API for you to do your own analysis.
We’d love to add the ability to filter some of our pre-prepared reports. So if you have a specific requirement that you’d like to see us implement then do get in touch with details and we’ll see what we can do.
Duane Jackson, November 27th, 201928th Feb '24

2nd May '23
